POSTS
Second Chipy Post
Link to Github Link to Heroku Website
I first started off by finding another dataset with grocery stores in Chicago because the first one was not all of the grocery stores. Then, I used Grocery Stores - 2013, however, this has convinience stores and liquor stores counting as Grocery stores. After searching for more, I decided to settle on this dataset for now since I needed to start coding. My first goal was loading the dataset as markers. The first issue I had was with the CSV file and I was having trouble loading it. I later found that the attributes are case-sensitive.
Another problem I’m having is that zoning codes are incredibly complex and it’s hard to determine what is residential and what isn’t. This is crucial to determining whether a region is a food desert due to a lack of food access or if it’s because it’s not a residential area.
After meeting with my mentor, Kevin Nasto, I learned about the Model-View-Controller (MVC) paradigm in web development and about using pandas to manipulate the dataset instead of using Numpy.
Originally, I was iterating the dataset like this:
for item in range(data.shape[0]):
This is me converting syntax from other languages. But this is more pythonic:
for neighborhood in boundaries_df.iterrows():
This is what makes Python so fun!
Pandas also has functionality that makes it simple to explore and understand the dataset. After, using Pandas I realized my initial use of Numpy for this case was completely wrong. Numpy is for storing and manipulating numerical values, where as the Pandas Dataframe is for all datatypes. Not only that, it provides functionality for making changes to the dataset, in other words, “clean” it and also provide statistical information.
Since I am working with geodata, it made more sense to use Geopandas. This library is built on top of Pandas and allows you to manipulate and query geodata (location, regions, etc)! It also has functionality to read from a GeoJson file which is a file format that store geodata as geometries. First, I needed to convert the dataframe’s locations as points in the geometry column. Geopandas already has this built in functionality! See below:
    import pandas as pd
    import geopandas as gpd
    data = pd.read_csv(filepath)
    data = gpd.GeoDataFrame(data, geometry=gpd.points_from_xy
                            (data.LATITUDE, data.LONGITUDE))
I want to tackle the food desert calculations in a systemic way by neighborhood. I pulled the neighborhood data from OpenData as well. I also needed to join the grocery data and neighborhood data in some way. However, I’m working with spatial data so this isn’t simple as a set join. But, worry not… Geopandas has a solution! It has this really cool functionality of spatial joins where you can perform an operation like “within” to join. This would check whether the point is within the neighborhood. This resulted in getting zero elements, so I’m still debugging. I believe this may be because I would need to do a projection into world coordinates before applying this spatial join.
data_and_nbhood = gpd.sjoin(data, boundaries_df, op="within")
Logically, this operation sounds very computationally intensive. My dataset is relatively small, so I determined that it is not that significant. However, I researched that there are tools like dask-geopandas which do these operations in parallel.
I also learned that Pandas has a feature to label columns as categorical. This means that the data values can take on a fixed set of values. This distinction will be useful later when performing aggregations on the dataset.
boundaries_df['neighborhood'] = boundaries_df.sec_neigh.astype('category')
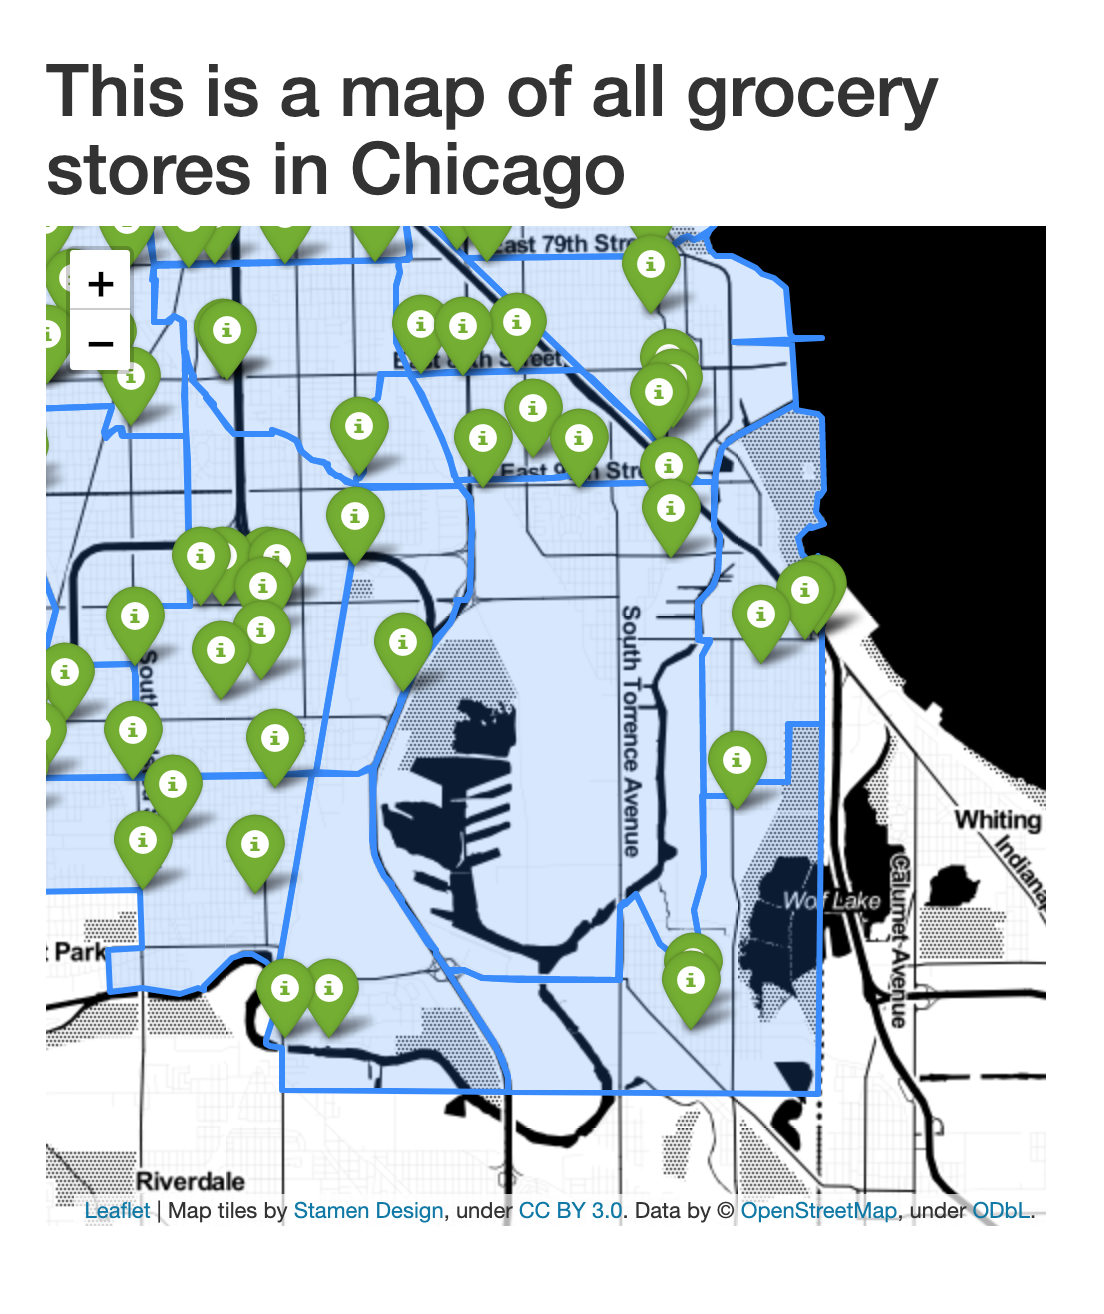
Great now I can view boundaries and my grocery store markers:

My next step would be to get the join to work and aggregate data for each neighborhood.
At some point I decided my website looked weird if it just had a giant map without any description or header. Now, I don’t know much frontend, so manipulating flask and html were a bit difficult since I was learning two things at once. Initially, the mistake I made was not storing the landing page in the right folder. jinja2 is a web templating library. I believe this is to avoid repeated code.
Here’s a snippet of how templating works:
{%extends "home.html"%}
{% block body %}
    {% include "map.html"%}
{% endblock %}
This line {% block body %} allows me to insert a snippet into home.html. I’m still learning about this functionality, so hopefully I get more familiar with it.
This past month, I had a lot of fun with Python and I certainly appreciate the quirks of the language. I’m starting to understand why it’s such a favorite. It’s already made coding a lot more enjoyable for me, and as a mentor/teacher to youth I always look for fun ways of teaching concepts. With Python, I think there can be an intersection of teaching math and science, as well as programming and even creating art. Trust me, I spent a lot of time reading the geopandas docs and there are cool visualizations you can make.
